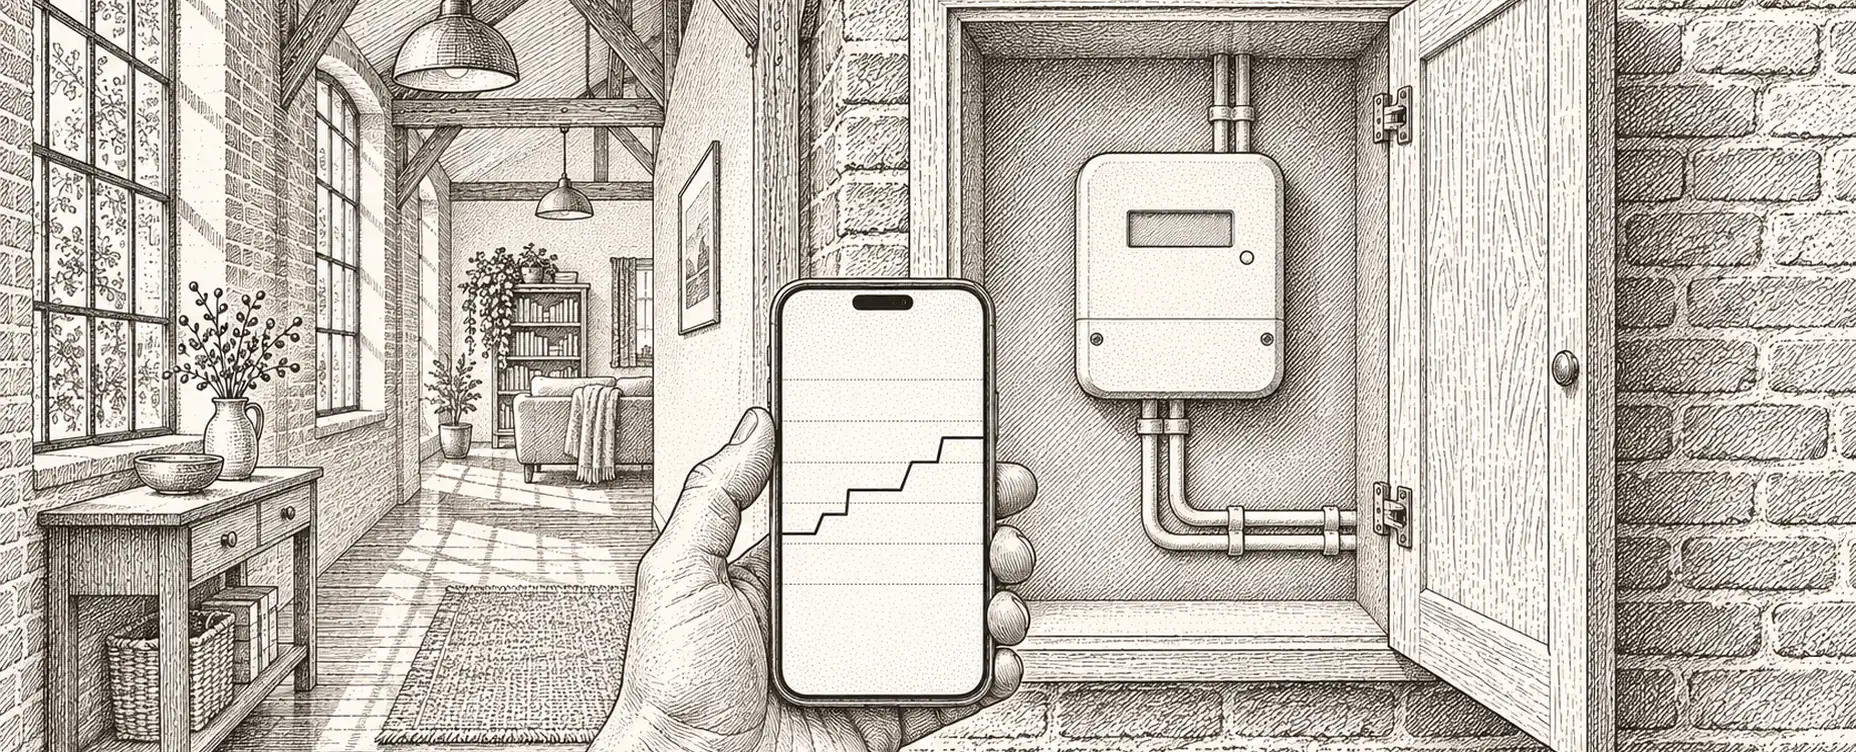
Almost every household in Europe now has a smart meter, and almost none of them use it for anything. The in-home display sits in a drawer, the supplier's app shows a monthly bar chart, and the genuinely useful data — readings every few seconds, in your own system, alongside everything else you measure — goes unused.
Getting at it is easier than most people think, and it changes what is possible.
What a smart meter actually offers
A smart meter does two separate things, and conflating them causes confusion.
It reports to your supplier over a wide-area connection, typically once a day or once every half hour, for billing. You have no control over this and it is not the useful part.
It also broadcasts locally, to a display or a device in your home, far more frequently — often every few seconds. This is the data worth having, and how you reach it depends entirely on where you live.
The distinction matters because “my supplier's app is slow and useless” is a complaint about the first thing, while the second may be sitting there unused.
How to get at it, by region
The Netherlands and Belgium: the P1 port. Dutch and Belgian meters have a standardised serial port — a P1 connector, physically an RJ12 socket — that outputs a full data message every second or few seconds, following the DSMR standard. A small reader plugged into it gives you instantaneous power, cumulative import and export per tariff, and on many meters gas consumption too. This is the best arrangement in Europe by a distance: open, local, documented, and no supplier involvement required.
Germany, Austria and parts of central Europe: the optical interface. Many meters have an infrared window that outputs data using SML or similar protocols. An optical reader head held on with a magnet reads it. Some meters require a PIN from your grid operator to unlock the full data set.
The UK: the consumer access device. UK smart meters have a home area network, and a consumer access device can join it to receive readings. The arrangement is more restricted than the Dutch one and typically involves a third-party service.
Scandinavia: the HAN port. Norwegian, Swedish and Danish meters commonly expose an RJ45 HAN port, sometimes needing activation by the grid operator. Once open it is comparable to P1.
Anywhere: a clamp meter. If none of the above works, a current transformer clamped around the incoming live conductor measures consumption regardless of meter type. It is less accurate, it usually cannot distinguish import from export without extra sensing, and it works everywhere.
What the numbers actually mean
Some vocabulary, because the units confuse people and the confusion leads to bad decisions.
Power, in watts or kilowatts, is a rate — how fast you are using electricity right now. A kettle is about 3 kW while it runs.
Energy, in kilowatt-hours, is a quantity — power multiplied by time. That kettle for five minutes is about 0.25 kWh. Your bill is in kilowatt-hours.
Confusing the two is why people worry about a high-wattage appliance that runs for two minutes and ignore a low-wattage one that runs permanently. A 3 kW kettle used for ten minutes a day is 0.5 kWh; a 40 W device left on continuously is nearly 1 kWh. The small constant thing wins.
Two more you will meet. Apparent power in volt-amperes differs from real power in watts for anything with a motor or a switching power supply, and the ratio between them is the power factor. Domestic billing is normally on real power, so it rarely matters, but it explains why some meters report figures that do not quite agree.
What becomes possible with live data
Once you have a reading every few seconds in your own system, a number of things follow that a monthly bar chart cannot support.
Finding your standing load precisely. Watch the figure at 3am and you have the number that everything else is measured against.
Identifying appliances by signature. A step of 2,000 W lasting three minutes is a kettle. A 200 W plateau cycling on and off is a fridge. With a live feed you can learn your own house's signatures and attribute consumption without metering every socket.
Real-time cost display. Showing what the house is spending per hour, right now, changes behaviour in a way a retrospective bill does not. This is well documented in energy feedback research and it is the cheapest behavioural intervention available.
Tariff optimisation. Combining live consumption with hourly prices lets you see what you are actually paying rather than an average, and lets automations act on it.
Export monitoring. If you have solar, knowing the instant you begin exporting is what lets you divert surplus into hot water, a battery or a car instead.
Load management. Live total consumption is what lets a controller throttle an EV charger before the main fuse trips, which is the practical requirement in an electrified home.
Anomaly detection. A standing load that jumps by 150 W and stays there means something switched on and did not switch off.
Gas and water, which are harder
Electricity is well served; the others less so.
Gas on a Dutch P1 feed comes through with the electricity data, typically updated every five minutes. Elsewhere, gas meters often report only to the supplier. Where a meter has a pulse output or a rotating dial with a magnet, a clip-on reader can count it, and some meters can be read optically.
Water is rarely smart at domestic level. Options are a supplier portal if one exists, a clip-on pulse reader where the meter supports it, or an inline flow sensor fitted after the stopcock — which is plumbing work and gives the best data.
Worth doing if you have a leak concern or a large garden; otherwise the monthly reading plus an overnight check is adequate.
Privacy, briefly and fairly
High-resolution energy data is genuinely revealing. Second-by-second consumption shows when you get up, when you leave, when you cook, when you are away, and with analysis can suggest which appliances you own.
This is an argument for keeping the detailed data local rather than routing it through a third-party service, which is another reason the P1 and optical approaches are attractive: the fine-grained data never leaves your house, and your supplier continues to receive only the billing readings it needs.
If you do use a cloud service, it is worth reading what it does with the data, because consumption data has commercial value.
Where to start
- Look at your meter and identify what interface it has — P1 socket, infrared window, HAN port, or none.
- Buy the matching reader, preferring one that publishes locally on your network rather than to a cloud.
- Record the 3am figure for a week. That is your standing load and your baseline.
- Learn three signatures — kettle, fridge, washing machine — by watching the live feed while you use them.
- Put a live cost figure somewhere visible to the household.
- Add gas if your feed provides it, and water only if you have a reason.
- Then automate: anomaly alerts, tariff shifting, export diversion, load management.
Steps three and four cost nothing beyond the reader and are where the understanding comes from. Everything you do afterwards is more sensible for having done them.